Benchmarks
Live Plotly figures (hover, zoom, toggle traces) from the benchmark suite. The suite isolates each optimization against good-faith, tuned baselines; the full dataset matrix, run commands, and the win-claim gate are in the benchmark plan.
Who wins where
insitubatch is the batteries-included choice across two operating points:
- Inference (cold start). It pays no worker-pool startup — first batch in ~0.2 s vs the worker stacks' 1–15 s — and a production inference service can't keep a hot 32-worker pool alive anyway. insitu wins cold-start at every chunk size measured.
- Training (across the chunk spectrum). It uses 8–25× less memory (one process, not
32), reads each chunk once (vs the baselines' per-sample re-decode), and keeps a
cross-epoch chunk cache in the pool (warm epochs at ~4 GB/s). Throughput beats the
best-tuned baseline from
c2up — to ~25× at fat chunks.
The honest exception is the GRIB end (c1, one sample per chunk): there xbatcher is
~30% faster on single-pass throughput, because with nothing to amortize per chunk insitu's
read-once advantage doesn't apply. insitu still wins memory (~25×) and cold start (~6× TTFB),
and its cross-epoch cache makes warm epochs ~9× faster than its own cold pass — though that is
measured against xbatcher without its (opt-in) cache enabled; see the
cache caveat. xbatcher is a well-established
batch definition on a worker-process engine; insitu keeps the same ndim batch semantics
with one async loop, so its edge grows with samples-per-chunk.
Real run
Numbers below are from a real S3 run on a
c6id.8xlarge
(32 vCPU, in-region S3 + S3 Express), not a laptop: coarsened ERA5 361×720
fields, the era5_c{1..32} chunk-size family plus fat-spatial grids, ≥3 repeats
with a warm-up burst to clear S3 cold-start. Both baselines are tuned
(num_workers swept to 32 = vCPUs); insitu is swept over block_chunks — so neither
side is under-tuned.
The comparison set
| Engine | What it is | Role |
|---|---|---|
insitu |
insitubatch: one async event loop, prefetch, shared cache | the system under test |
naive |
sequential synchronous reads, one sample at a time | the floor |
workers |
map-style Dataset + DataLoader(num_workers=N) |
the realistic baseline |
xbatcher |
xbatcher.BatchGenerator + DataLoader (the xbatcher worker stack) |
the credibility bar |
memory |
data preloaded into RAM, compute only | the in-memory ceiling |
Each engine is reported at its tuned optimum (insitu over block_chunks, the
DataLoader baselines over num_workers).
Story 1 — chunks, not samples
insitubatch reads each stored chunk once and vector-gathers every sample inside
it; a map-style __getitem__ decodes the whole containing chunk to return one
sample. So the win grows with samples-per-chunk — throughput vs the best-tuned
baseline (MB/s, warm), across the chunk spectrum:
| sample_chunk | 1 | 2 | 4 | 8 | 16 | 32 |
|---|---|---|---|---|---|---|
| insitu | 283 | 483 | 514 | 630 | 617 | 657 |
| xbatcher (tuned) | 372 | 432 | 242 | 101 | 55 | 26 |
| workers (tuned) | 292 | 420 | 216 | 85 | 43 | 31 |
| naive | 30 | 43 | 56 | 31 | 20 | 21 |
| insitu vs best | 0.76× | 1.1× | 2.1× | 6.2× | 11× | ~21–25× |
The baselines re-decode the containing chunk per sample, so they waste (sample_chunk−1)/
sample_chunk of their bytes; insitu reads once. The advantage therefore grows linearly
with chunk size and shrinks to a slight loss at the GRIB end (c1, one sample/chunk —
nothing to amortize).
Throughput by engine, and the baseline tuning
The DataLoader baselines are reported at their best num_workers — they keep scaling
toward 32 and still top out well below insitu:
For reference, the in-memory ceiling (whole array in RAM, zero IO) runs ~7.6–7.9 GB/s;
insitu at c8 is ~0.7 GB/s — the gap is IO, not loader overhead (see story 4).
Story 2 — decoupling concurrency from residency
Read concurrency (max_inflight) is decoupled from residency/shuffle (block_chunks):
throughput climbs to the network knee and stays flat, while residency is pinned,
as max_inflight rises. The result is a clean rise-to-plateau, the same on every spatial
grid (era5_fat_g4/g16/g36):
| max_inflight | 1 | 4 | 8 | 16 | 32 | 64 | 128 | 256 |
|---|---|---|---|---|---|---|---|---|
MB/s (fat_g16) |
23 | 108 | 276 | 883 | 1078 | 1071 | 1102 | 1129 |
| resident chunks | 16 | 16 | 16 | 16 | 16 | 16 | 16 | 16 |
You dial throughput from 23 → ~1130 MB/s purely via max_inflight, at constant memory
— concurrency and residency are independent knobs.
The acceptance gate that justified the rewrite (exp_c, c6id.8xlarge)
Kept for the record: the v1-vs-V2 A/B that decided the scheduler rewrite. Fat data
(sample_chunk=200, ~830 MB outer chunks), in-region S3, median of 5.
v1 baseline — read concurrency rode on block_chunks, so throughput peaked at the
smallest window and fell as the window grew (the nested caps overshoot):
block_chunks (≈ resident) |
single-inner MB/s | spatial (grid 15, read_conc 16) MB/s |
|---|---|---|
| 2 (~3.3 GB) | 76 | 930 |
| 4 (~6.6 GB) | 120 | 871 |
| 8 (~13 GB) | 178 | 724 (oversubscribed) |
V2 result — same box, block_chunks=2 fixed, sweeping the single max_inflight budget:
max_inflight |
8 | 16 | 32 | 64 | 128 |
|---|---|---|---|---|---|
| MB/s | 388 | 788 | 1052 | 970 | 970 |
resident (chunks) |
4 | 4 | 4 | 4 | 4 |
V2 beats the v1 spatial peak (1052 vs 930) at the same low memory, and residency is
flat at 2×block_chunks for every max_inflight — concurrency dialed independently of
memory. Past the knee (mi≈32) throughput settles to a stable 970 plateau instead of v1's
collapse to 724 under oversubscription. Re-run after the B2 admission rewrite
(resident_cap → byte-budget pin/LRU) to confirm no regression: 981 / 981 / 988 MB/s at
mi = 32 / 64 / 128, resident = 4 throughout — the plateau sits a touch below the
original 1052, inside the cold-S3 run-to-run spread.
Story 3 — the cache (decode-once across epochs)
With a budget that holds the split (--caches resident, spilled to NVMe), epoch 2 reads
come from the pool — no S3, no decode — so warm ≫ cold:
| sample_chunk | cold MB/s | warm MB/s | speedup |
|---|---|---|---|
| c1 | 430 | 3977 | 9.2× |
| c8 | 777 | 4526 | 5.8× |
| c32 | 750 | 4557 | 6.1× |
The cross-epoch probe on fat_g16 confirms it independently (1006 → 4509, 4.5×).
What this does — and doesn't — compare
This is insitu with its cache against the worker stacks reading S3 each epoch — i.e.
xbatcher without caching (the bench engine builds BatchGenerator with no cache=).
xbatcher does have an opt-in cache
(docs): it serializes
assembled batches to a zarr store that persists across epochs and across runs. insitu
now persists across runs too (persist=True), but this figure uses neither persistent
cache — it measures insitu's in-process cross-epoch cache against the uncached worker stacks.
The designs differ in kind: insitu caches decoded chunks in
the pool (no second copy, deduped across samples/splits, reusable under any shuffle order
or batch transform); xbatcher caches materialized batches (a separate copy in batch
layout with a fixed shuffle/augmentation baked in). A fair cache-vs-cache run (xbatcher
cache= enabled) is future work; read the table as insitu's cache vs the uncached default.
Story 4 — efficiency vs the raw-GET ceiling
How much of the NIC do we keep? insitu's decoded MB/s as a % of the raw-GET ceiling
(obstore reading the same bytes, no decode/gather), on fat_g16:
| storage | insitu (decoded) | raw-GET ceiling | % kept |
|---|---|---|---|
| S3 | 1187 | 1467 | 81% |
| S3 Express One Zone | 1261 | 1501 | 84% |
So ~80% of the network ceiling survives decode + gather. S3 Express saturates the ceiling
at concurrency 16 (single-digit-ms GETs) where regular S3 needs 32–64, and it rescues
the GRIB end: insitu c1 runs 820 MB/s on Express vs 283 on S3 (2.9×). On a 25 Gb/s box
this ceiling roughly doubles and Express separates further from standard — see
Scaling.
Scaling — the same workload on faster hardware
Re-running on a c6id.16xlarge (64 vCPU, 25 Gb/s — double the c6id.8xlarge's NIC)
isolates what was network-bound. These are additional real-hardware data points, not design
changes.
Raw-GET ceiling and insitu decoded throughput (fat_g16, MB/s, median of 5):
fat_g16 |
12.5 Gb/s (8xlarge) | 25 Gb/s (16xlarge) |
|---|---|---|
| raw GET — S3 standard | 1467 | 2548 |
| raw GET — S3 Express | 1501 | 2868 |
| insitu decoded — S3 standard | 1187 | 1591 |
| insitu decoded — S3 Express | 1261 | 1904 |
Two things the bigger pipe reveals:
- The 12.5 Gb/s box was NIC-bound. Both buckets capped at ~1.5 GB/s (≈12 Gbit/s); doubling the NIC nearly doubles raw GET (standard +74%, Express +91%), and decode keeps pace (insitu +34% / +51%). Express now reaches ~23 of 25 Gbit/s.
- S3 Express separates from standard only once you're off the cap. At 12.5 Gb/s the two
were a statistical tie (both pipe-limited); at 25 Gb/s Express hits its ceiling at
concurrency 32 where standard needs 128, and is far steadier run-to-run (single-AZ). On
the latency-bound GRIB end (
c1) the gap is largest — Express beats standard 2–9× per engine (e.g. xbatcher 883 → 1939 samples/s, workers 327 → 2546).
Worker count is a property of the chunk layout. The c1 suite on the fast box also
sharpens the engine trade-off. At the GRIB end (one tiny GET per sample, request-rate-bound)
the worker fan-out's warm throughput leads and more workers help (xbatcher best at 64).
At fat chunks the opposite holds — each worker re-decodes the whole chunk per sample, so
adding workers multiplies decode and throughput falls (the
WeatherBench2 walkthrough measures xbatcher dropping 289 → 110 samples/s
from 16 → 64 workers). insitu keeps the cold-start/TTFB and consistency edge in both regimes;
the worker stack's warm-throughput win is specific to the c1 extreme.
Memory + cold-start by engine (G5/G6)
The suite's per-row RSS can't compare engines (single-process high-water; the 32 worker
children of workers/xbatcher aren't counted). probe_memory runs each engine in its
own subprocess and samples peak RSS over the whole process tree. Read-once (anon
working set), so it's apples-to-apples:
c1 (GRIB):
| engine | peak RSS | procs | TTFB cold | warm MB/s |
|---|---|---|---|---|
| insitu | 0.9 GB | 1 | 0.2 s | 333 |
| workers | 19.9 GB | 35 | 3.3 s | 534 |
| xbatcher | 22.6 GB | 34 | 1.3 s | 588 |
c16 (fat) — insitu wins every axis:
| engine | peak RSS | procs | TTFB cold | warm MB/s |
|---|---|---|---|---|
| insitu | 3.1 GB | 1 | 0.7 s | 908 |
| workers | 23.4 GB | 34 | 15.3 s | 47.9 |
| xbatcher | 27.1 GB | 34 | 15.6 s | 48.9 |
→ ~8× memory, ~19× throughput, ~22× TTFB. insitu's footprint is one Python+obstore process (paid once); the baselines pay the interpreter floor 32× plus a 208 MB field re-decoded per sample at fat chunks. The independent WeatherBench2 run on the real public store (walkthrough, identical 48×32 samples, xbatcher at its best worker count) makes it concrete: xbatcher manages ~290 samples/s at ~850 ms to first batch, insitu ~4450 samples/s at ~320 ms — ~15× throughput and ~2.7× TTFB, because WB2's fat time-chunks punish the per-sample decode while insitu reads each chunk once.
Store backends — obstore vs fsspec/gcsfs on HTTP GCS
The engine reads a zarr Store, so the backend is swappable (--backend obstore|fsspec).
On plain HTTP GCS (n2-standard-8), obstore wins the transfer floor decisively.
Decode-free raw concurrent GET, best of a 4→32 concurrency sweep, MB/s:
| chunking | obstore | gcsfs (cat_file) |
obstore lead |
|---|---|---|---|
| c1 | 1211 | 529 | 2.3× |
| c4 | 1581 | 606 | 2.6× |
| c16 | 802 | 487 | 1.6× |
The mechanism is visible in the sweep: obstore scales with concurrency (c1 raw: 376 → 681 → 1042 → 1211), while gcsfs plateaus at ~500–600 MB/s and degrades past 16 threads (c1: 343 → 513 → 529 → 358) — the per-request Python/aiohttp path on the single fsspec loop is the ceiling.
End-to-end (fetch + decode) the gap compresses to ~1.15–1.2×, but only because this 8-core box is decode-bound at ~450 MB/s (the decode-threads sweep saturates 445 → 456 at 4–8 threads, well under obstore's raw 0.8–1.6 GB/s), so both backends hit the same decode wall. Read that ~20% as a floor on fsspec's HTTP penalty: on more cores or with a faster codec pipeline the fetch gap re-widens toward the ~2× raw number.
Takeaway: obstore stays the HTTP default; fsspec is not a co-equal fast path on HTTP, but it is not a correctness regression either. Its case rests entirely on the Rapid/zonal gRPC path obstore cannot reach — that experiment has not run yet, so read this section as "obstore wins HTTP", not "fsspec is worse".
Free-threading readiness
insitubatch's throughput is GIL-independent by design: the heavy work already runs
outside the GIL — fetch (obstore/Rust), decode (numcodecs zstd, C), gather
(vectorized numpy) — and scheduling is a single asyncio loop, so there is no GIL-held
hot path for free-threading to accelerate. (Decode even parallelizes under the GIL:
zstd releases it, so the decode_threads sweep scales 1→2 on the GIL build too.) On the
3.13 free-threaded build the engine is correct — deliveries never collide and readiness
is published under the lock, so the lock, not the GIL, is the happens-before edge — and it
runs at the same speed as the GIL build.
So free-threading here is correctness + future-proofing, not a speedup — and not
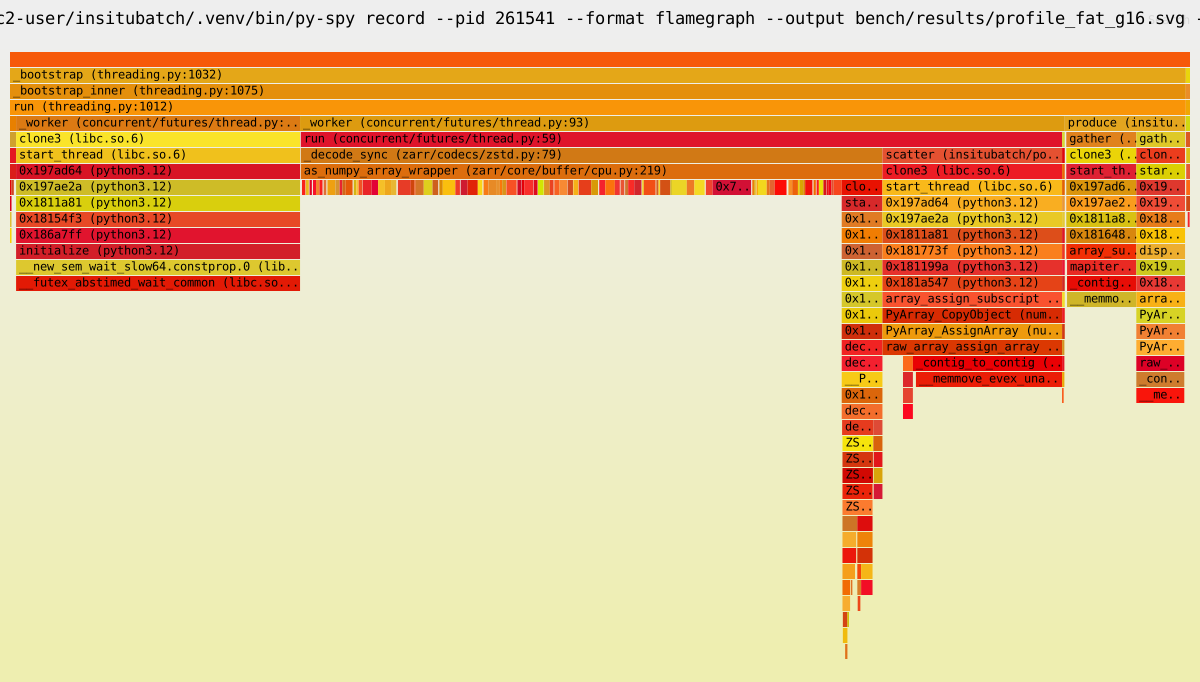
depending on the GIL is a stronger position than needing it. The
flamegraph
(py-spy --native) makes it visual: time is in Rust IO + C decode + numpy, with only a
thin Python sliver.
Keeping the accelerator fed — stall vs the compute ceiling
Stories 1–4 measure the loader against other loaders on a CPU box. This one asks a
different question on a GPU: when a real training step is pulling batches, what
fraction of the GPU's time is spent waiting on data (data_stall_fraction) versus
computing? The reference is the compute ceiling — the identical training loop with
the data preloaded in RAM (zero IO), i.e. the fastest this model can possibly run. insitu's
% of ceiling is how much of that the streaming loader keeps.
GPU run
A real advection-forecast training loop (a small conv net, --device cuda) on a
g2-standard-16
(1× NVIDIA L4, 16 vCPU, us-central1-a). Data is WeatherBench2 (the public ARCO
ERA5 store) for the read-depth sweep, plus synthetic incompressible-f32 stores for the
geometry sweeps. 5 epochs × 5 repeats per config (bench/advection_sweep.py),
median reported; the loop trains — on WB2 held-out data the model beats persistence
(24 h RMSE 1.98 vs 2.23), so this is a forecaster, not a throughput harness.
The headline: insitu keeps the L4 94–98% fed, and the loop is compute-bound, not IO-bound. The heavier the per-sample compute, the closer to the ceiling — decode overlaps more compute — so growing the field only tightens the result. Median across repeats:
| workload (geom) | compute ceiling | insitu (warm) | % of ceiling | warm stall |
|---|---|---|---|---|
| WB2 128×64 | 1406 samp/s | 1330 | 94.6% | 3.5% |
| synthetic 64² | 4392 samp/s | 3842 | 87.7% | 10.4% |
| synthetic 128² | 588 samp/s | 577 | 98.0% | 1.8% |
| synthetic 256² | 145 samp/s | 143 | 98.4% | 0.5% |
The only config that dips is the smallest field (64²): cheapest compute per sample, so IO is the largest share and stall rises to ~10% — and even there insitu keeps ~88%. You cannot reach an IO-bound regime by making the field bigger (bytes and conv cost both scale with pixels); only by shrinking it, and insitu stays ahead when you do.
Read-ahead depth is a cold-start knob, not a throughput knob
Throttling max_inflight (concurrent in-flight reads) on the real WB2 store stretches the
cold first-fill but leaves steady state untouched — after epoch 0 the cross-epoch
cache (story 3) serves every read, so prefetch depth stops mattering:
| max_inflight | 1 | 2 | 4 | 8 | 16 | default |
|---|---|---|---|---|---|---|
| cold TTFB | 3.46 s | 1.20 s | 0.66 s | 0.45 s | 0.35 s | 0.32 s |
| epoch-0 stall | 80.5% | 40.0% | 19.3% | 14.0% | 11.1% | 10.4% |
| warm samp/s | 1332 | 1327 | 1330 | 1329 | 1327 | 1332 |
| warm stall | 3.7% | 3.7% | 3.6% | 3.6% | 3.7% | 3.4% |
This is the honest form of "stall rises when you starve the prefetcher": it rises only in the cold fill, where read-ahead is doing real work (single-inflight stretches first-batch latency 10×, 0.32 → 3.46 s), and vanishes once warm. Steady-state throughput and stall are flat across the whole depth sweep.
Across the chunk spectrum, the loader stays ahead
Sweeping the sample chunk from fat (256) toward the one-sample-per-read GRIB end (4), and
fanning a fat chunk out into spatial tiles (inner_chunk 128 → 32), both hold ~98% of the
ceiling on the 128² load — the geometry barely moves the result:
| sample_chunk (fat → GRIB) | 256 | 64 | 16 | 4 |
|---|---|---|---|---|
| % of ceiling | 98.2 | 98.1 | 97.4 | 97.3 |
| warm stall | 1.8% | 1.8% | 2.1% | 2.3% |
Shrinking the chunk 64× toward GRIB costs ~1% of the ceiling; spatial tiling is flat within noise. On this compute load the loader is never the bottleneck — the deferred baseline head-to-head (below) is where the chunk spectrum separates engines. The only visible cost is again in the cold fill: TTFB rises as chunks shrink (0.41 → 0.73 s) or fan into more tiles (0.40 → 1.21 s), since both mean more, smaller first-fill reads.
Batch buffers — what they're worth is a range, and your loop picks the point
The loader reuses its batch output buffers rather than allocating one per batch, and
as_torch(..., device=...) / pin_host_buffers put those buffers in page-locked memory and
own the H2D copy. The two are separate changes with separate payoffs, and each is only
visible on the axis it acts on.
Read every number below as a point in a range, not a headline. Both optimizations remove loader-side cost, so their end-to-end value is bounded above by what an isolated probe measures with that cost fully exposed, and below by zero — because a loop whose compute step already hides the loader gets nothing, which is prefetch doing its job. Where a given workload falls is decided by one thing: how much compute it spends per byte delivered.
| upper bound (loader cost exposed) | our GPU training loop | lower bound | |
|---|---|---|---|
| reuse | +10 … +16% above 32 MiB | ≈ 0 (±0.3 pt) | 0 |
| pinning | copy hidden entirely below ~37 MiB | +1 … +2% | 0 |
The advection loop runs at 98.7–100% of its compute ceiling, so for reuse it is the lower bound rather than an interior point — a well-fed GPU is the hardest case for a loader optimization to show up in, by construction. These land differently because they act on different sides: reuse saves producer-thread time, which prefetch is built to hide, while pinning shortens a copy on the consumer's critical path, which prefetch cannot.
So the workloads that collect the top of these ranges are the ones spending less compute per byte — inference rather than training, shallow models, cold caches, IO-bound epochs. A saturated training GPU is where you should expect the least.
Reuse: a payload-size cliff, not a speedup
Above glibc's 32 MiB mmap threshold a fresh batch is mmaped and munmaped every
batch — a syscall trace shows 12 full-buffer pairs per 12-batch epoch without reuse and 2
with it — so the kernel re-zeroes the whole buffer each time. Below that threshold the freed
block is recycled on the heap and reuse is a small cost instead.
The upper bound, with allocation cost fully exposed (bench/batch_buffer_sweep.py, L4,
--inner 256,256, arms alternated):
| MiB/batch | 8 | 16 | 32 | 64 | 128 |
|---|---|---|---|---|---|
| no reuse (samples/s) | 5404 | 5186 | 4435 | 4585 | 4765 |
| reuse | 5240 | 5060 | 5148 | 5173 | 5266 |
| delta | −3.0% | −2.4% | +16.1% | +12.8% | +10.5% |
Read the shape, not a headline number. Reuse holds throughput flat across a 16× payload range while fresh allocation falls off a cliff; the small-batch end pays 2–3%. Weather-shaped batches sit in the losing region — a fraction of a percent of a step, but a cost, not a wash.
The lower bound is a GPU training loop, where the cliff does not surface at all. Sweeping
batch size over one 256² store (--sweeps payload, 5 epochs × 5 repeats), with the no-reuse arm run from a checkout
identical but for the gather call site, and each arm scored against its own in-session
ceiling:
| MiB per variable buffer | 8 | 16 | 32 | 64 |
|---|---|---|---|---|
| reuse (% of ceiling) | 99.69 | 99.92 | 99.74 | 98.74 |
| no reuse | 99.49 | 99.72 | 99.92 | 99.03 |
| delta (points) | +0.21 | +0.20 | −0.18 | −0.29 |
Inside ±0.3 points with the sign flipping twice — a null across an 8× payload range. The loop
runs at 98.7–100% of its compute ceiling, so producer-side allocation has nowhere to surface,
including above 32 MiB where the mmap path demonstrably engages (0 faults per allocation
at 8 and 16 MiB, 100% of pages at 32 and 64). At 64 MiB the two arms' absolute throughput
agrees to 0.04% (138.52 vs 138.57 samples/s) — there the 0.29-point gap is the two
sessions' ceilings differing, not the loader. Every arm returned a persistence RMSE of
0.588030696, bit-identical, so the paths provably deliver the same bytes.
So a saturated GPU sits at the bottom of reuse's range, and that is the expected place for it: prefetch exists to hide exactly this cost. The value is real at the other end — the +10–16% above — and it is collected by loops that do less compute per byte, plus the guarantee that growing your batch past 32 MiB cannot walk you off a cliff.
Pinning: +1 to +2% end to end, and drift is half the signal
| geometry | payload/step | estimate | method |
|---|---|---|---|
| 256² batch 128 | 128 MiB | +1.5% (bounds +0.8 … +2.2%) | A/B/A bracket |
| 256² batch 32–128 | 32–128 MiB | +2.0 … +2.3% | cross-session ceilings |
Both agree on the sign; they disagree on magnitude by about 1.5×, and the gap is the
measurement error. An A/B/A at batch 128 — unpinned, pinned, unpinned, back to back — read
145.4 / 146.6 / 143.4 samples/s. The two identical unpinned blocks differ by 1.4% some 20
minutes apart, systematically (each block's own repeats agreed to ±0.3). Fitting that as a 1.0
samples/s per-block decline puts the unpinned baseline at 144.4 in the pinned slot against an
actual 146.6, hence +1.5%; taking b−a or b−c instead gives +0.8% or +2.2%.
Round it to +1 to +2% and do not quote a third digit. The honest reading is that pinning
is a real but small win whose size is not resolved by ~0.7%-per-block drift, and that closing
that gap needs --pin alternated per repeat inside one sweep rather than more hand-run
blocks.
Unlike reuse, this is an interior point in its range rather than the floor. In isolation
(bench/probe_batch_buffers.py --arms overlap) a pinned copy below ~37 MiB is hidden
completely — the pinned arm sits on the compute floor, while a pageable one costs more than
its own transfer time, because it stages through a driver bounce buffer and cannot overlap at
all. Pinning survives a compute-bound loop where reuse does not because it shortens work on
the consumer's critical path; prefetch can hide producer-thread cost, but it cannot hide
the step's own copy.
Use the right metric for each — they differ
% of ceiling is right for reuse and wrong for pinning. Reuse changes only the loader,
so scoring against the in-session ceiling isolates it and divides drift out. Pinning
changes a copy both sides perform: --pin reaches the ceiling too, because
pin_host_buffers runs before preload_epoch, which is list(ds.train). The ceiling then
moves with the loader (+2.0–2.3% in lockstep) and % of ceiling cancels the effect —
it sat at ~99.8% across a pinned A/B while absolute throughput moved 2.2%. For pinning,
read bracketed absolute throughput and nothing else.
Run the control arm twice, before and after the treatment, and read the treatment against their interpolation. A single back-to-back pair carries roughly ±0.7% of drift on an unchanged checkout — the same size as these effects.
Reproduce the no-reuse arm with INSITUBATCH_NO_BUFFER_REUSE=1 rather than a second
checkout; the epoch log stamps REUSE OFF so those rows stay identifiable. Do not combine
it with --pin for a timing row: the pin budget is a monotone counter sized for a pool
that converges, so without reuse it is spent within a few batches and the rest of the run
silently runs pageable. The pool warns when you do it. It is still the right way to ask
whether reuse is corrupting a pinned run — a correctness question, not a throughput one.
The ceiling is sampled once per geometry per run (do_ceiling = ceiling and r == 0)
while insitu gets every repeat, so % of ceiling inherits a single measurement's noise and
resolves only ~1 point however many repeats you add. The 64² row is the least reliable:
fastest, shortest, and it drifted monotonically (95.2 → 94.4 → 94.2 → 93.0) across
alternating arms. Prefer 128².
Deferred
- Pinning at large payloads — measured only at 0.5–8 MiB here, where the probe says the win is smallest. Microscopy-scale batches (≥32 MiB) are where both halves should be worth the most, and neither has been run end to end at that size.
- GPU baseline head-to-head — the section above establishes insitu stays GPU-fed
(94–98% of the compute ceiling); the matching
compute_mssweep of the worker stacks stalling once IO-bound is still to run. - GPU-native path (M2) —
device_transformafter DLPack; GPU-utilization graphs.
Reproduce
Full dataset matrix and per-story commands are in the benchmark plan. The story-1 spectrum on a pre-generated S3 family, then rebuild the figures:
uv run python -m bench --url-prefix "s3://$BUCKET/era5" \
  --out bench/results/story1_spectrum.jsonl \
  --engines naive,workers,xbatcher,insitu --chunk-sizes 1,2,4,8,16,32 \
  --num-workers 32 --max-batches 64 --repeats 3 --warmup-batches 32

uv run python -m bench.plot --in bench/results/story1_spectrum.jsonl --out docs/figures --cdn